Measuring soil organisms
This topic has 7 questions:
- How can the number of microorganisms in a soil be measured?
- How many soil animals are there in soil?
- What techniques are used to identify and study soil organisms?
- How are rhizobia identified?
- How is a plant pathogen identified?
- What are the current future methods for measuring soil nitrogen supply?
- Can mid infrared technologies be used to measure soil nitrogen supply?
Question 1. How can the number of microorganisms in a soil be measured?
The whole mass of living organisms in soil is called its microbial biomass. The microbial biomass can be estimated by measuring the amount of carbon, nitrogen, phosphorus or sulfur that is present in the microorganisms in the soil. There are a number of different ways of measuring microbial biomass.
For example:
- The fumigation-incubation technique: Two samples of soil are collected. One is not treated; this is called the untreated soil. The other sample is treated with a fumigant to kill all the organisms in it. Living organisms are then added back into the fumigated soil and the sample is left to incubate. During incubation, the living organisms degrade a proportion of the dead organisms. The difference between the amount of carbon dioxide released from the untreated soil and the treated soil samples is used to estimate the amount of respiration that has occurred during the degradation process. Respiration is then used to estimate the amount of carbon degraded which correlates to a certain biomass of microbes. (Only a proportion of the organisms will be degraded, so this is taken into account).
- The fumigation-extraction method: Two soil samples are collected, one remains untreated and the other is fumigated to kill all the organisms. The amount of carbon, nitrogen or phosphorus that has been released into the soil from the dead microorganisms is then measured to determine microbial levels.
- The substrate-induced respiration method: Two soil samples are collected, one remains untreated and the other is fumigated to kill all the organisms. A source of energy (e.g. sugar) is added to the untreated soil so that the organisms in the soil can be more active. When they are more active, they respire (breathe) more and so release more carbon dioxide. The amount of carbon dioxide released by the organisms in the treated soil is then compared to the untreated soil to calculate the probable mass of microorganisms in the soil.
- Using ATP or enzyme activity: ATP is the name given to one of the molecules that carries energy inside living things. Enzymes are proteins that help reactions to go faster. The amount of ATP or specific enzymes in soil indicates how many organisms are in that soil.
Question 2. How many soil animals are there in soil?
The number of individual soil animals in the soil is enormous. In all but the driest environments there are billions of protozoa per square metre (m²), millions of nematodes/m² and 100,000’s of mites/m². In a pasture soil from east Beverley in Western Australia there were approximately 800 million protozoa, 900,000 nematodes and 130,000 mites per square metre.
Question 3. What techniques are used to identify soil organisms?
Soil organisms are identified by studying their:
- morphology - structure and shape
- physiology - what happens inside them
- genetic characteristics - DNA structure
- ecological characteristics - where they live and how they interact with other living things
- molecular characteristics - whether they have particular parts of genes and the type of proteins or molecules they produce.
Question 4. How are rhizobia identified?
Rhizobia are one of the groups of microorganisms living in soil. They can form a mutually beneficial association, or symbiosis, with legume plants. Rhizobia are very difficult to identify from their shape or size alone because all forms are extremely small, short rods with rounded ends.
New methods of rhizobia characterisation have been developed using DNA patterns from known rhizobia grown under laboratory conditions. Comparisons are made between sections of the known DNA molecule that code for particular functions (e.g. nitrogen fixation) with samples of DNA from soil or from a root nodule. This tells the scientists whether there are genes for that function in the soil sample or root nodule.
Serological techniques can also be used to identify rhizobia. Samples of known bacteria are injected into an animal under specific laboratory conditions. The animal's body produces antibodies against the bacteria. (A process that is similar to vaccination). The component of the blood containing the antibodies is the serum and this is separated from the red blood cells. This is called antiserum.
The antiserum produced by the animal can be collected and used to help locate bacteria in a sample. The antibodies in the antiserum can be joined to a fluorescent dye or to an enzyme with an attached dye. When the antibody is added to the corresponding bacteria it attaches firmly. The bacteria can then be identified using a fluorescence microscope or in a solution that contains a molecule that can interact with the enzyme and cause a colour change in the solution. This method is called the ELISA method.
The antiserum can be chosen to be very specific for particular types of rhizobia, so it is a good way to identify whether those rhizobia are present in a root nodule. It is often important to know whether the rhizobia that were added with the seed have actually been responsible for forming the nodules on the legume or whether other rhizobia already in the soil formed the nodules.
Question 5. How is a plant pathogen identified?
In the 1880's, a scientist named Koch proposed a method for identifying the organism responsible for a disease. When his procedure is applied to identifying plant diseases the following must occur for the identification to be successful:
-
An organism is isolated from a plant showing symptoms of the disease.
-
The organism is grown separately from other organisms and the host (on an artificial food source).
-
The organism is placed into contact with a healthy plant and the plant develops the same symptoms of the disease.
-
The organism is isolated from the second diseased plant.
Question 6. What are the current future methods for measuring soil nitrogen supply?
Soil nitrogen supply is the release nitrogen crop residues and organic matter in soil as they are decomposed by microorganisms. Soil nitrogen supply is currently measured in the laboratory using a method that takes a week to complete. This method is thus both too costly and slow for use as a decision support tool for fertiliser application rates.
However, in the future it may be possible to use mid infrared technology to measure soil nitrogen supply quickly and inexpensively. The advantage of the mid infrared technology is that once it is established, soil samples can be collected from the field and scanned in approximately 2 minutes per sample. This considerably decreases analytical costs meaning that growers could afford to have more soil samples analysed enabling spatial maps to be generated or deeper soil layers to be assessed.
Question 7. Can mid infrared technologies be used to measure soil nitrogen supply?
Mid infrared is not as accurate as measuring soil nitrogen supply by standard analytical techniques. However, it may be useful for developing maps of soil nitrogen supply across a farm. These maps could be used to allow for variable application rates of nitrogen fertiliser to be applied.
For example, soil was collected under an oat crop at Dangin in 2003 using a 25m x 25m sampling grid (180 separate sampling points over 10 hecatres). Soil nitrogen supply was measured using standard laboratory methods and also predicted using mid infrared technology. This intensive sampling grid was used for assessing the required sampling grid size for farm management application. The spatial maps below show that there was good agreement between soil nitrogen supply as measured using the standard technique (Figure 1) and as predicted using mid infrared (Figure 2).
This data suggests optimal crop yields would require additional fertiliser to be applied to the red and yellow areas. In a good rainfall year, low fertiliser nitrogen application would also be of benefit in the light blue area. Fertiliser nitrogen may not be economic on the dark blue areas as soil nitrogen supply is already sufficient to satisfy the crop’s demand for nitrogen.
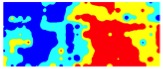
Figure 1. Standard laboratory detection of biological soil N supply – Data from soil samples (0-10 cm) collected on a 25 m x 25 m sampling grid. Colours areas where biological soil N supply was categorised into 4 ranges: red = very low, yellow = low, light blue = moderate and dark blue = high (data courtesy of Daniel Murphy and Nui Milton, the University of Western Australia).
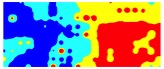
Figure 2. Mid infrared predicted biological soil N supply – Data for the same 10 ha area as that shown in Figure 1 (i.e. the pattern of colour on figure 2 would be identical to that on figure 1 if the mid infrared prediction was 100% accurate). The same colour groupings apply (data courtesy of Daniel Murphy and Nui Milton, the University of Western Australia).
Search Site
- Soil Health
- Help/Feedback
- Contact us
- Sitemap